TL;DR
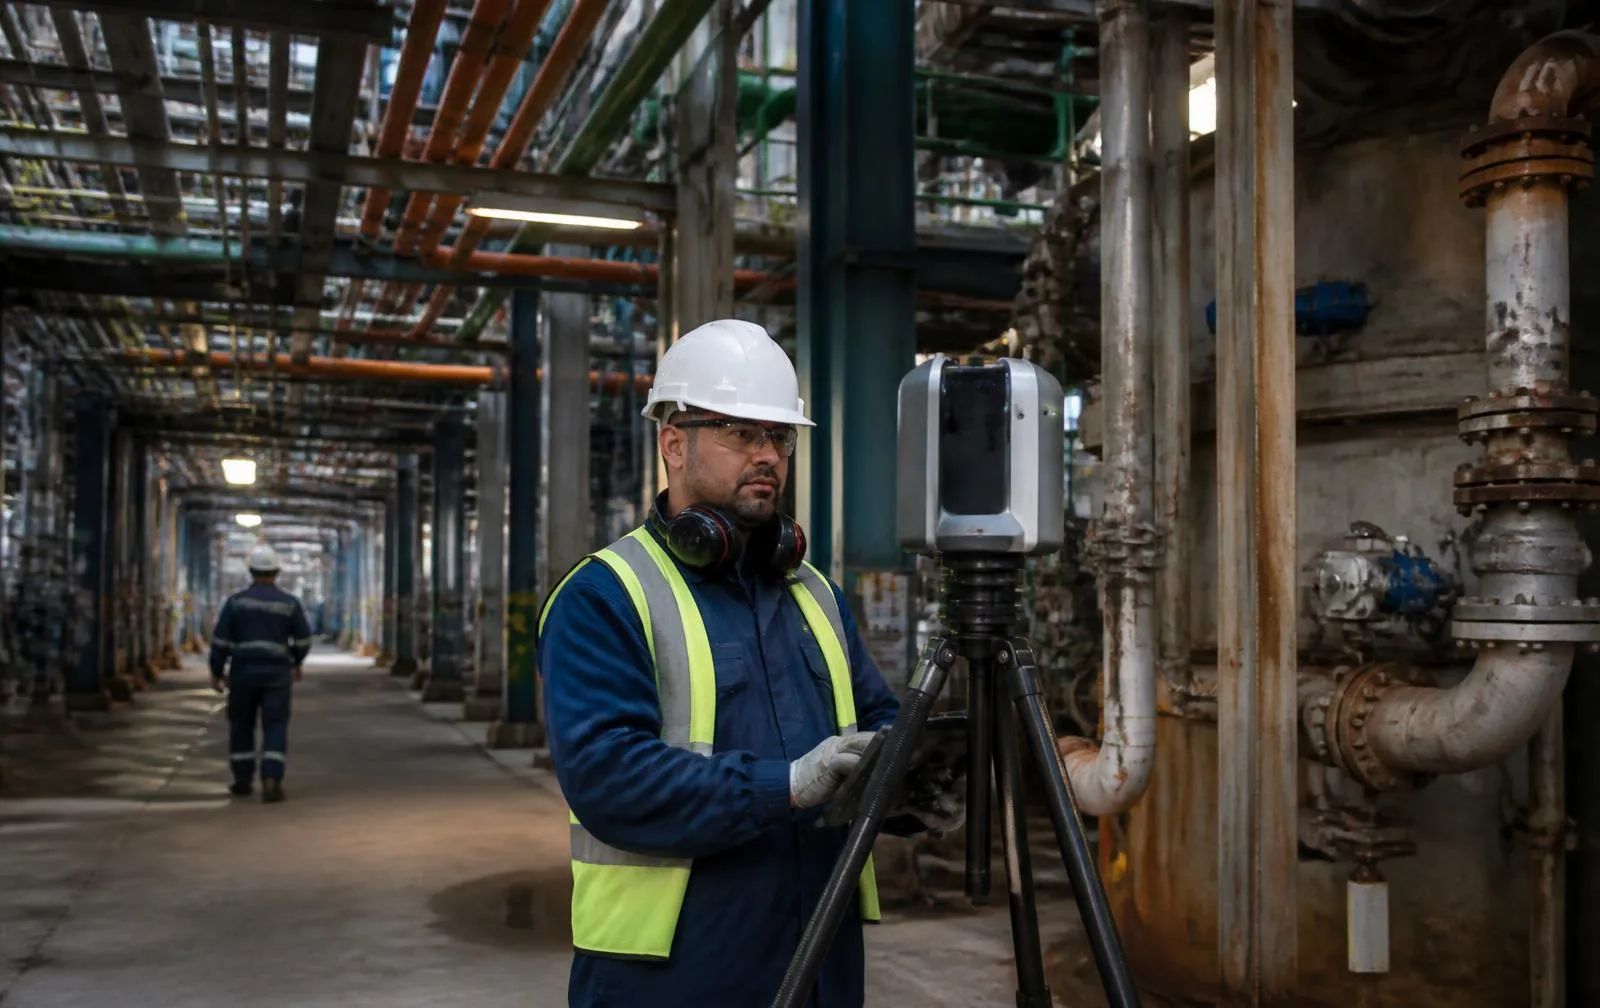
Industrial facilities are the hardest environment reality capture handles — dense piping, reflective surfaces, live operations, and legacy drawings that routinely disagree with the floor. We scan them with a hybrid mobile + terrestrial methodology registered to ±6mm, working entirely around production schedules with zero required downtime. On a recent 220,000 sq ft process plant, that approach delivered full coverage in 5 field days.
Industrial facilities are the hardest environment reality capture handles — dense piping, reflective surfaces, live operations, and legacy drawings that routinely disagree with the floor. We scan them with a hybrid mobile + terrestrial methodology registered to ±6mm, working entirely around production schedules with zero required downtime. On a recent 220,000 sq ft process plant, that approach delivered full coverage in 5 field days.
Why does industrial scanning need a different approach than a commercial building?
Commercial interiors are relatively open and stable. Process plants are the opposite: dense pipe racks, vessels and equipment that occlude sight lines, reflective metal surfaces that scatter laser returns, and live machinery that can't simply be worked around by scheduling. A mobile-only approach struggles with the density and the reflectivity; a terrestrial-only approach is too slow to cover an entire plant. The answer is both — mobile LiDAR for coverage, terrestrial setups locked down exactly where fabrication tolerance can't tolerate error.
What does the hybrid methodology actually look like?
| Method | Where it's used | Why |
|---|---|---|
| Mobile LiDAR (walking pace) | Floor plates, corridors, mezzanines | Fast full coverage across the plant footprint |
| Terrestrial static setups | Tie-in points, pump skids, valve clusters | Highest-precision geometry where fabrication tolerance is unforgiving |
| Registered accuracy | ±6mm, tied to plant control | Reflects real hybrid-capture conditions, not idealized single-method accuracy |
A real project: 220,000 sq ft, 5 days, zero downtime
A mechanical retrofit needed verified conditions across two buildings of dense process piping, with 21 days until layout had to start and no production stoppage available. We ran hybrid capture — mobile LiDAR for coverage plus 38 terrestrial setups at critical tie-ins — and registered the whole facility at ±6mm. The resulting model exposed 143 pipe runs routed differently than the existing P&IDs and plans showed. That single finding retired 26 RFIs early and avoided an estimated $340,000 in rework. The schedule held, with days to spare against the 21-day deadline.
Why do industrial drawings so routinely disagree with reality?
Nearly every plant shares the same problem: decades of maintenance reroutes, undocumented tie-ins, and as-designed drawings that never reflected as-built conditions in the first place. Retrofit engineering that starts from those drawings is starting from partial fiction. Scanning replaces that with measured reality — every pipe run, rack, vessel, and structural member exactly where it actually is, not where a decades-old drawing says it should be.
Does the plant have to stop running?
No — this is the constraint every industrial scanning plan is built around from the start. Capture happens on second-shift windows, aisle-by-aisle sequencing timed to never block production traffic, and brief steady-state holds only where reflective or moving equipment genuinely requires it. The plant's schedule sets the plan, not the reverse — which is exactly how the 220,000 sq ft project above achieved zero downtime.
What do you actually receive?
- Classified point clouds by system (process, steam, condensate, utility) in E57, RCP, or LAS
- LOD 300 models of structure, equipment, and pipe 2 inches and larger
- Tie-in verification packages for the highest-stakes interfaces
- 2D plans and sections at every elevation, for teams that live in AutoCAD
- A full panoramic record of the facility as captured
Who actually commissions industrial scanning?
- Plant engineers planning retrofits and tie-ins against verified conditions
- Mechanical contractors prefabricating spools that need to fit the first time
- Owners documenting facilities for long-range capital planning
- EPC firms requiring verified existing conditions before design
- Operations teams mapping process lines for internal use
On retrofit work, scanning is consistently one of the smallest line items in the budget — and it protects the largest ones. Exposing misrouted lines, elevation drift, and clearance conflicts before demolition starts is routinely worth six figures in avoided rework, as the numbers above show.
What does the capture-to-delivery process actually look like?
- Site and safety planning. The capture plan is coordinated with operations and safety staff, and around any shutdown windows that exist.
- Hybrid capture. Mobile LiDAR covers the general floor plate; terrestrial setups lock down geometry wherever tie-in tolerance demands it.
- Registration and classification. Data is registered to plant control and classified by system — process, steam, utility, structure.
- Engineering handoff. Point clouds, models, and 2D extracts are delivered to your engineering team's standards, not a generic template.
Why does downtime planning matter more here than anywhere else in reality capture?
Because in an operating plant, the cost of getting the schedule wrong isn't a delayed deliverable — it's lost production. That's why the capture plan is built around the plant's actual operating rhythm from day one: second-shift windows where they exist, aisle-by-aisle sequencing that never crosses a live production path, and brief steady-state holds only in the specific spots where reflective or moving equipment genuinely interferes with the scan. Nothing about the plan asks the plant to slow down or stop — the scan is scheduled to fit around what's already happening, which is exactly how the 220,000 sq ft project above hit zero downtime against a 21-day deadline.
See the full case study or our guide on tolerance analysis for engineers for more on how the accuracy figures translate into real design decisions.