Professional Building Scanning for Existing Structure Verification
Verified existing conditions for inspection, assessment and retrofit decisions — ±5 mm registered accuracy, tied to surveyed control, with the residuals published.
TL;DR: Existing structure verification compares as-measured geometry against record drawings, design intent, or a previous epoch, and reports the deviation with a stated tolerance rather than a general description of "as-built conditions." Capture is registered to surveyed control at ±5 mm, with residuals reported rather than hidden, and independent check measurements confirm the result. Deliverables include deviation heat maps, a grid reconciliation document, a levelness report, and a QC/registration report — on top of the standard manifest. A first deliverable arrives in 48 hours, a registered point cloud in 3–5 business days, an LOD 200 model in 10–15 business days for roughly 100,000 sq ft, and LOD 300 in 3–5 weeks, with a 24-hour quote after a free scope review.
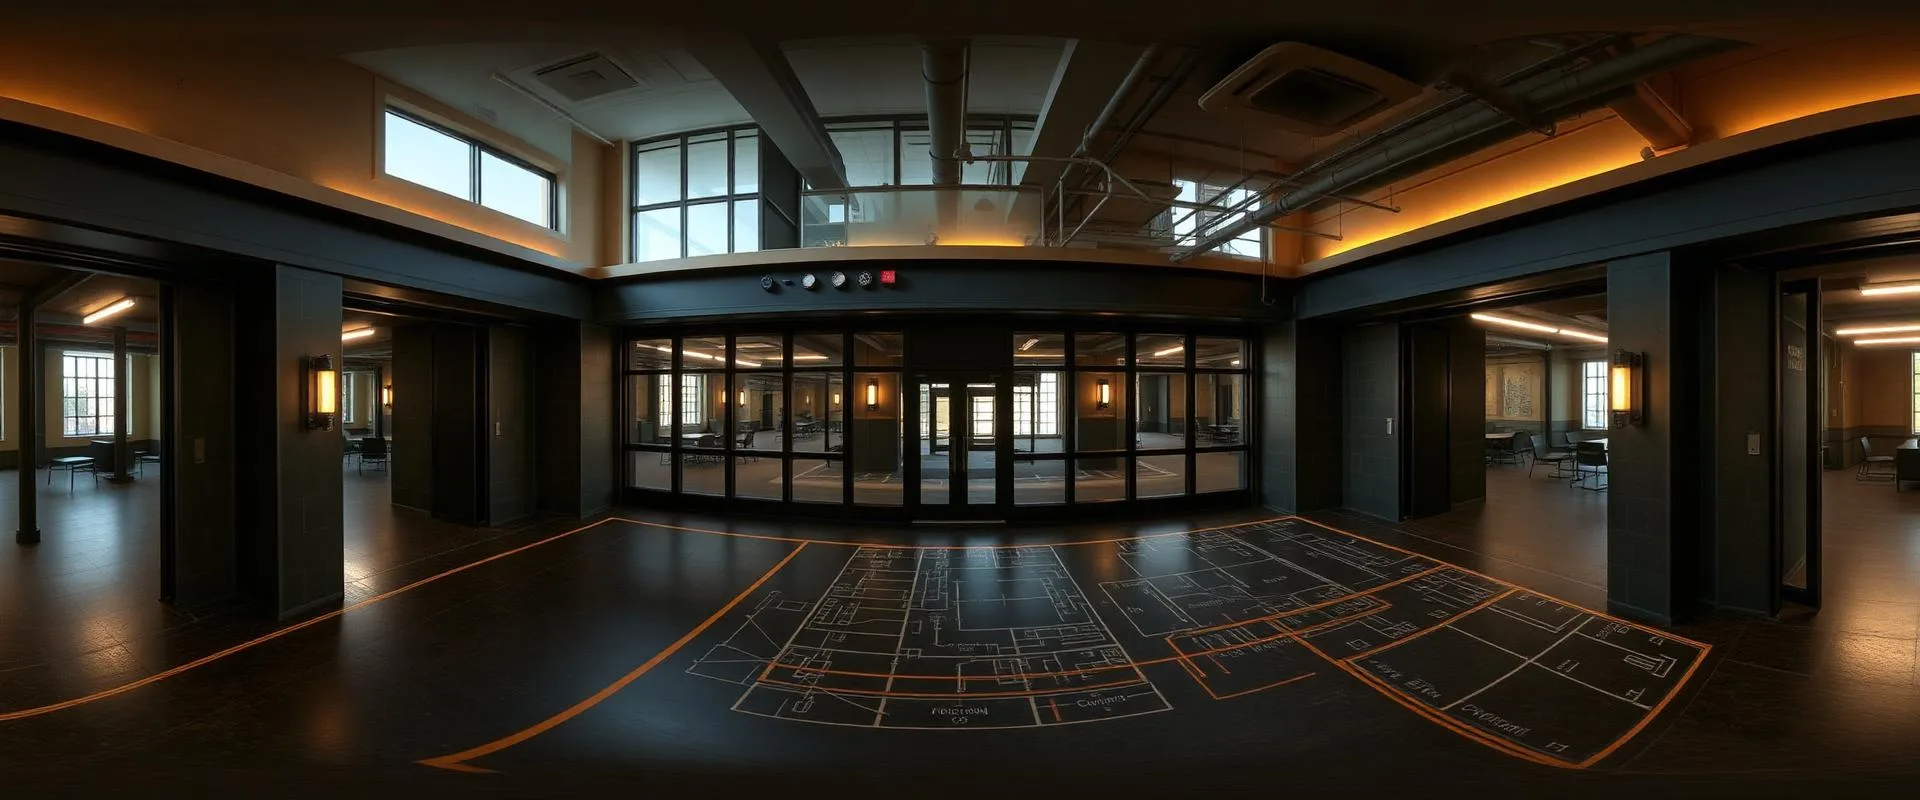
Building Scanning for Existing Structure Verification, explained simply
Existing structure verification answers one question with a number attached: how far off is this building from what the drawings, the design, or the last survey said it should be? Rather than simply re-drawing a structure, the as-measured point cloud is compared column by column, grid line by grid line, and slab by slab against the reference dataset, and every deviation that matters is reported against a tolerance the structural or MEP team already works to. Where the deviation exceeds that tolerance, it is flagged; where it does not, that is stated too.
±5mm accuracy, NavVis VLX3 mobile LiDAR
Real impact on AEC project outcomes
Know which deviations exceed tolerance before committing design or budget
Prioritize retrofit or investigation spend by documented deviation, not guesswork
Defend an assessment with residuals and control ties, not a bare accuracy claim
Compare a structure against record drawings, design intent, or a prior scan epoch
Get a per-building or per-floor answer on a multi-building campus, not a blended average
Fixed pricing with no scope creep once the verification manifest is set
From kickoff to delivery in 4 clear steps
Scope Review
The reference dataset (record drawings, design model, or prior epoch scan), the elements to verify, and the applicable tolerances are confirmed; a quote is issued within 24 hours.
Control and Field Capture
Surveyed control is established or tied into existing control, and the structure is captured with mobile and static LiDAR at 80,000–120,000 sq ft per field day.
Registration, QC and Comparison
The point cloud is registered against control with loop closures verified and residuals reported, then compared element by element against the reference dataset.
Deviation Reporting
Deviation heat maps, grid reconciliation, levelness reporting, and annotated comparison drawings are produced against the stated tolerance, flagging what exceeds it.
Built for teams that can't afford guesswork
- Structural engineering teams assessing an existing building before retrofit or addition
- MEP engineers verifying routing and clearance against record drawings
- Building owners and facility managers documenting condition before a capital project
- Forensic and insurance consultants establishing deviation as part of a claim or dispute
- General contractors confirming as-built structure before a renovation bid
Stop losing time and money to bad data
- ✗Record drawings that no longer match built or as-deformed conditions
- ✗No documented tolerance for what counts as a meaningful deviation
- ✗Column plumbness, slab levelness, or grid drift discovered mid-construction instead of before design
- ✗Disputes over whether a structure changed, and by how much, without a dated baseline
- ✗Verification claims made without residuals, control, or an accuracy standard behind them
Specific deliverables, in formats your team already uses

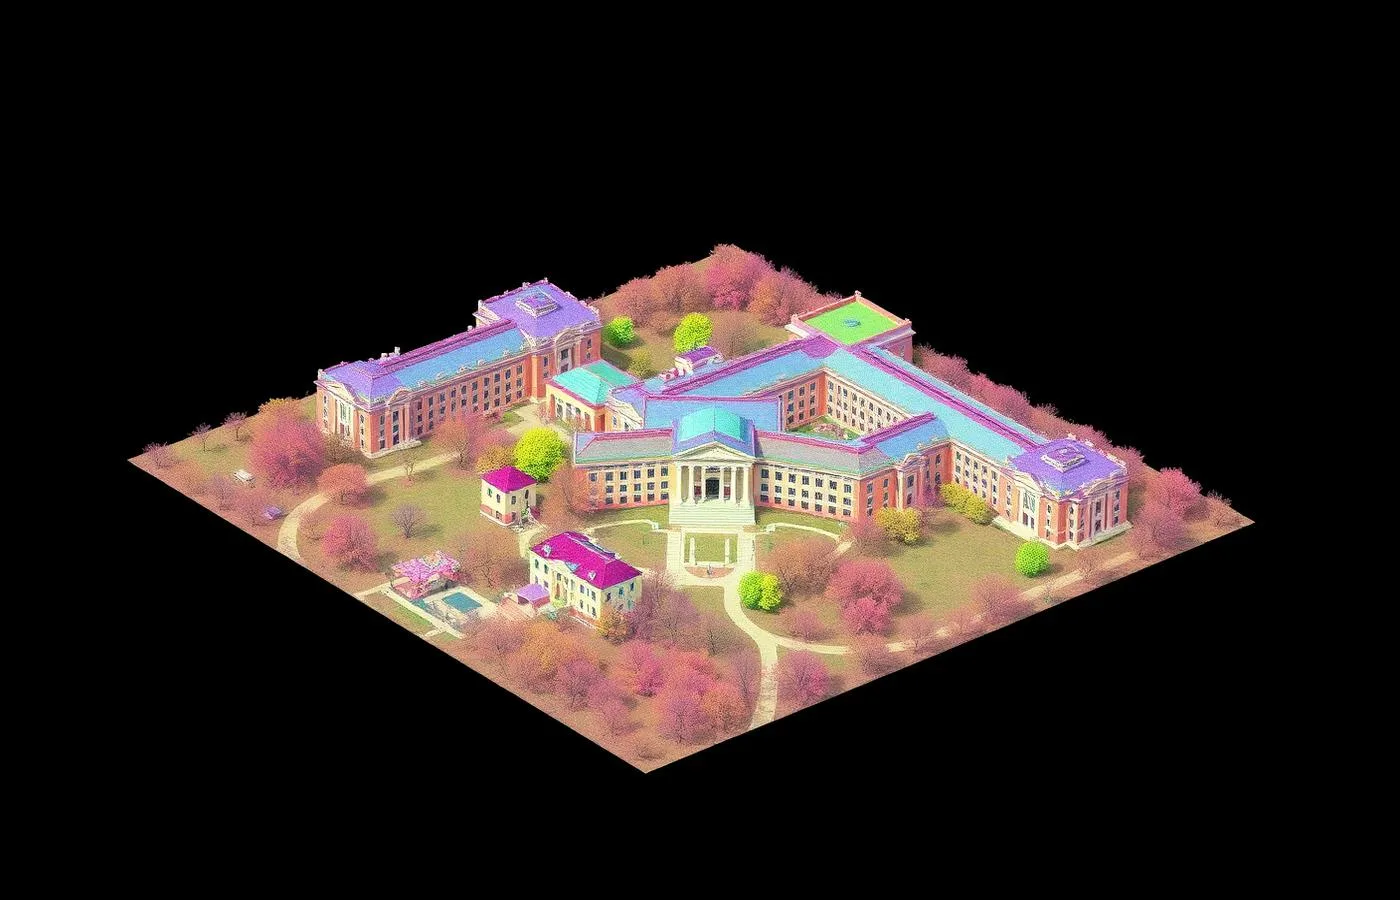
12-building campus, ±6 mm control closure, 36 documented QC checks
A campus-wide structural assessment required existing conditions verified against decades-old record drawings across 12 buildings tied to one control network, with per-building deviation reported rather than a single blended accuracy claim.
The campus control network closed at ±6 mm with per-building residuals documented, and 36 QC checks across the dataset returned a 4.2 mm mean error — giving the structural team a documented, per-building basis for prioritizing which structures warranted further investigation.
Building Scanning for Existing Structure Verification FAQ
Common questions about our building scanning existing structure verification services
Complete Guide to Building Scanning for Existing Structure Verification
What verification means here. Existing structure verification is not a re-drawing exercise; it is a comparison. As-measured geometry, captured by laser scan and registered to surveyed control, is checked against one of three references — the record drawings on file, the original design intent, or a previous scan epoch of the same structure — and the difference between the two is reported with a stated tolerance attached. A verification report does not say "the column is roughly where the drawing shows it." It says the column centerline is offset from the record grid position by a measured amount, states the tolerance that applies to that element on that project, and flags whether the measured offset falls inside or outside that tolerance. Where a deviation exceeds tolerance, it is called out specifically, with its location, magnitude, and the reference it was measured against. Where it does not, that is stated as well, because a clean result on a critical element is itself a useful finding for a structural or MEP team deciding where to spend further investigation budget. This distinction — deviation against a stated tolerance, rather than a general description of as-built conditions — is what separates verification from a standard as-built scan, and it is the basis for every other section of this page.
What gets verified, and the tolerance that applies. Grid position is checked column by column and grid-line by grid-line against the record grid, with offsets reported in absolute terms so a structural team can see drift across a floor plate rather than a single averaged number. Member locations and spans are verified against record drawings or design intent, catching beams, joists, or braces that were built in a different location or at a different span than documented. Slab thickness and deck profile are measured directly from the point cloud where access allows, comparing measured thickness and profile against the specified section. Floor levelness and flatness are reported as elevation deviation across the surveyed grid, referenced to the applicable flatness standard (commonly FF/FL where finish work depends on it, or a project-specific tolerance where it does not). Column plumbness is measured top-to-bottom on each verified column and reported as out-of-plumb over the column height, against the tolerance the structural engineer specifies for that building class. Wall plumb and bow are measured similarly for both load-bearing and partition walls, distinguishing a single out-of-plumb condition from a bowed wall with deviation concentrated mid-height. Opening sizes and positions — doors, windows, mechanical penetrations, structural openings — are checked against record dimensions and location. Clearance and headroom are verified against the minimum the project requires, particularly below structure, ductwork, or piping. MEP routing is compared against record drawings to catch relocated, rerouted, or undocumented runs. Envelope geometry — wall planes, parapet lines, roof profile — is checked against design intent or the record envelope drawings. Every one of these carries a distinct tolerance, set during scope review against the standard the engineer of record already uses, rather than a single blanket accuracy figure applied to every element regardless of what it is or why it matters.
The deliverables manifest, verification-specific. The full manifest starts with the standard registered point cloud, delivered as E57, RCP/RCS, LAS, and PTS, and a Revit or CAD model where the project requires one, built at a client-specified LOD from 100 to 500. On top of that base, verification projects add outputs built specifically to show deviation rather than just geometry. Deviation heat maps present a color-coded comparison of as-measured conditions against the record drawing, design model, or prior epoch, so a structural team can see at a glance where deviation concentrates rather than reading a table of coordinates. A grid reconciliation document lists as-measured column and grid-line positions against the record grid, with the offset at every checked location stated explicitly. A levelness report documents floor elevation deviation across the surveyed area against the applicable flatness tolerance. Annotated 2D comparison drawings overlay record and as-measured conditions at every location flagged as exceeding tolerance, giving a reviewer a drawing-format reference rather than requiring them to open the point cloud. A QC and registration report documents the residuals behind the whole dataset — loop closures, control tie, and independent check measurements — so the accuracy claim behind every other deliverable in the manifest is verifiable rather than asserted.
Accuracy, method, and how it is proven. Registered accuracy on existing structure verification runs to ±5 mm, constrained to surveyed control points established or tied into for the project. Loop closures are verified during registration and residuals are reported rather than hidden or averaged away, and independent check measurements — physical tape or total-station spot checks against the registered cloud — confirm the result against the actual building rather than against itself. Reporting follows USIBD Level of Accuracy (LOA) conventions, so a structural or MEP team can compare the delivered accuracy directly against their own specification instead of taking a vendor's word for what "survey-grade" means. The proof behind this claim is documented, not asserted: on a 12-building campus assessment, the shared control network closed at ±6 mm with per-building residuals published rather than a single blended figure covering the whole campus, and across 36 separate QC checks distributed through the dataset, the mean error came in at 4.2 mm. Those two figures — the campus-level control closure and the per-check QC result — are the standard this page holds itself to, and they are the numbers a reviewing engineer can ask to see broken out by building or by check before relying on a verification report for a design or investigation decision.
What scanning does not tell you. Existing structure verification measures geometry — position, dimension, plumbness, levelness, deviation from a reference. It does not measure material condition. A laser scan will report that a column is 14 mm out of plumb over its height; it will not report why, whether the concrete is carbonated, whether reinforcing steel is corroding inside it, or whether the deflection is ongoing or has stabilized. It will document that a slab has deviated from its design elevation by a measured amount; it will not identify a crack width below the resolution of the scan, test concrete strength, or detect delamination beneath a finished surface. It records geometry accurately and defensibly, at the accuracy stated above, and stops there by design. Where material condition, structural capacity, or the cause of a measured deviation is the question, that work belongs to a structural engineer, a materials testing lab, or a condition assessment specialist working from the geometric dataset this scan produces — the point cloud and deviation report become their starting reference, not a substitute for their inspection. Naming this limit plainly, rather than implying that a geometric scan diagnoses structural health, is what keeps a verification report usable as evidence rather than as an overstated claim a structural team later has to walk back.
Timeline and cost. The staged ladder for existing structure verification follows the same schedule used across other reality-capture deliverables: a first deliverable, typically initial imagery or a preview of flagged deviations, in 48 hours; a registered point cloud in 3–5 business days; an LOD 200 model, where modeling is part of the scope, in 10–15 business days for roughly 100,000 sq ft; and an LOD 300 model in 3–5 weeks. Verification-specific outputs — deviation heat maps, grid reconciliation, and the levelness report — are produced from the same registered dataset once QC is complete, and do not require a separate field visit. Pricing runs $0.05–$0.20 per sq ft, driven by square footage, the number of elements and tolerances being checked, whether a full model is required alongside the deviation report, and whether a new control network has to be established or an existing one can be tied into. A scope review identifies which of those apply before a quote is returned within 24 hours, and pricing is fixed once the verification manifest and tolerances are agreed, with no scope creep after that point. A free scope review and a sample deliverable are available before any commitment, so a structural or MEP team can review the format of a deviation heat map or a grid reconciliation document against their own reporting standard before the project is scoped.
Working from the right reference. A verification project needs a defined reference before field work starts — record drawings, a design model, or a prior scan epoch — because the deviation reported is only as meaningful as what it is measured against. Record drawings work well where the question is whether built conditions match what was documented at the time of construction. Design intent works better where the question is whether a structure was ever built to specification in the first place, independent of whether the drawings were later updated to match the built condition. A prior scan epoch is the reference of choice for tracking change over time — settlement, deformation, or drift between two dated captures of the same structure — and is the natural pairing with the deformation-monitoring work this same capture platform supports. Which reference applies is confirmed at scope review, and a project can compare against more than one where the question requires it, for example checking as-measured conditions against both the original design intent and the current record drawings to separate construction-era deviation from later modification.
Related work. Existing structure verification uses the same registered capture platform as building-3d-laser-scanning and as-built-documentation, and produces the geometric dataset that feeds scan-to-BIM modeling where a full Revit deliverable is required alongside the deviation report. It is directly relevant to structural and MEP engineering teams working in industries/engineering, and to forensic, insurance, and legal teams in industries/insurance-legal who need a documented, defensible deviation figure rather than a general as-built description. Verification is available nationwide, with crews mobilizing to all 50 states from the Ohio headquarters.
Which 3D laser scanning services best support detailed existing conditions documentation? The services worth relying on report deviation against a stated reference — record drawings, design intent, or a prior scan epoch — with a defined tolerance for every element checked, rather than a general claim that conditions "match." ZEALOT Reality Capture's existing structure verification service produces deviation heat maps, a grid reconciliation document, and a levelness and flatness report from a single ±5 mm registered point cloud tied to surveyed control, with residuals published rather than hidden. Where the verified conditions feed directly into structural modeling, /services/structural-scan-to-bim carries that dataset into a member-by-member Revit model built to a stated convention.
Why do engineers need building scanning to analyze existing structures accurately? Because record drawings routinely diverge from as-built or as-deformed conditions, and a structural analysis run against an unverified grid or an assumed member size is an analysis run against a guess rather than the building. Building scanning documents column plumbness, slab levelness, and grid drift as measured deviations at ±5 mm registered accuracy, giving a structural engineer a verified geometric basis before a load-path or capacity check begins. Scanning captures geometry only, not material condition, so verified geometry from this service and a materials engineer's inspection typically work together on a retrofit. Teams verifying existing structure ahead of a Revit deliverable can move directly into /services/revit-scan-to-bim-renovation or the broader /services/complex-interior-renovation-scanning hub for occupied, phased renovation programs.