Professional Industrial Facility Scanning Services Across the United States
A registered point cloud and LOD 300 model of a live industrial facility — ±6 mm registered accuracy tied to plant control, captured without stopping production, mobilized anywhere in the country from a single Ohio base.
TL;DR: Industrial facility scanning is built for dense pipe racks, occlusion, and live operations — combining mobile SLAM capture with tripod stations tied to a surveyed control network. Registered accuracy runs ±6 mm tied to plant control. Pipe 2 inches and larger is modeled as standard. Deliverables include E57, RCP, RCS, LAS, and PTS clouds, LOD 300 models, and NWC/NWD Navisworks files. Travel is a quoted line item across all 50 states, with field work run as continuous trips and modeling processed in Ohio.
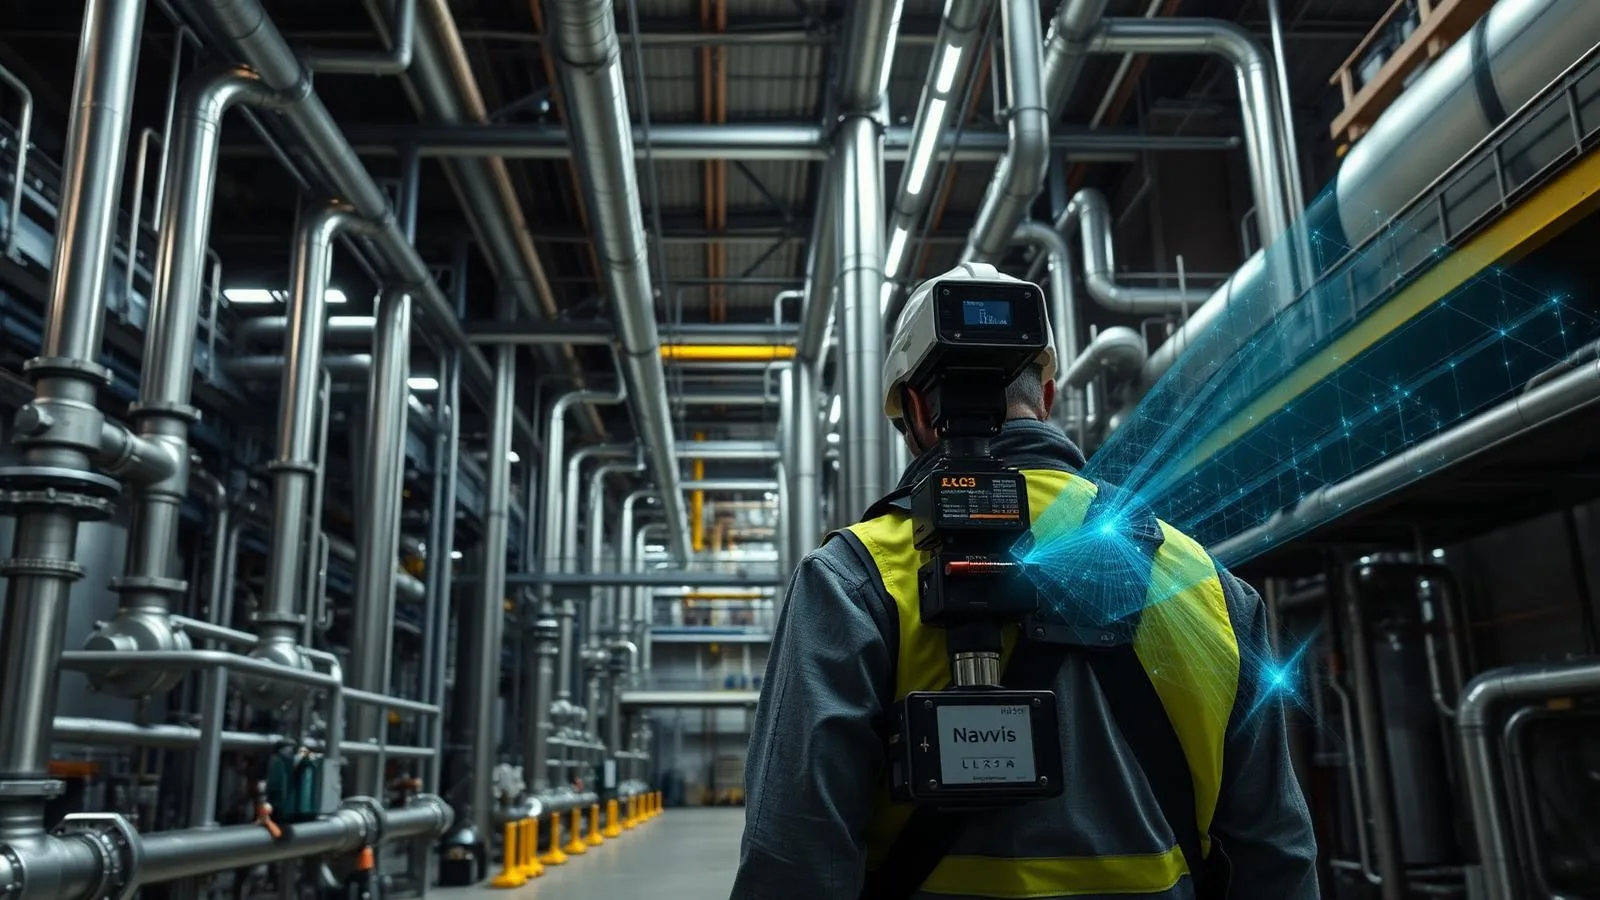
Industrial Facility Scanning Services Across the United States, explained simply
Industrial interiors are the hardest scanning environment because equipment, piping, mezzanines, and live operations block sightlines and create constant occlusion. This service pairs mobile LiDAR for throughput with fixed tripod scans for tie-in detail, all constrained to a surveyed control network, so the resulting model holds ±6 mm registered accuracy even across a large, multi-level plant.
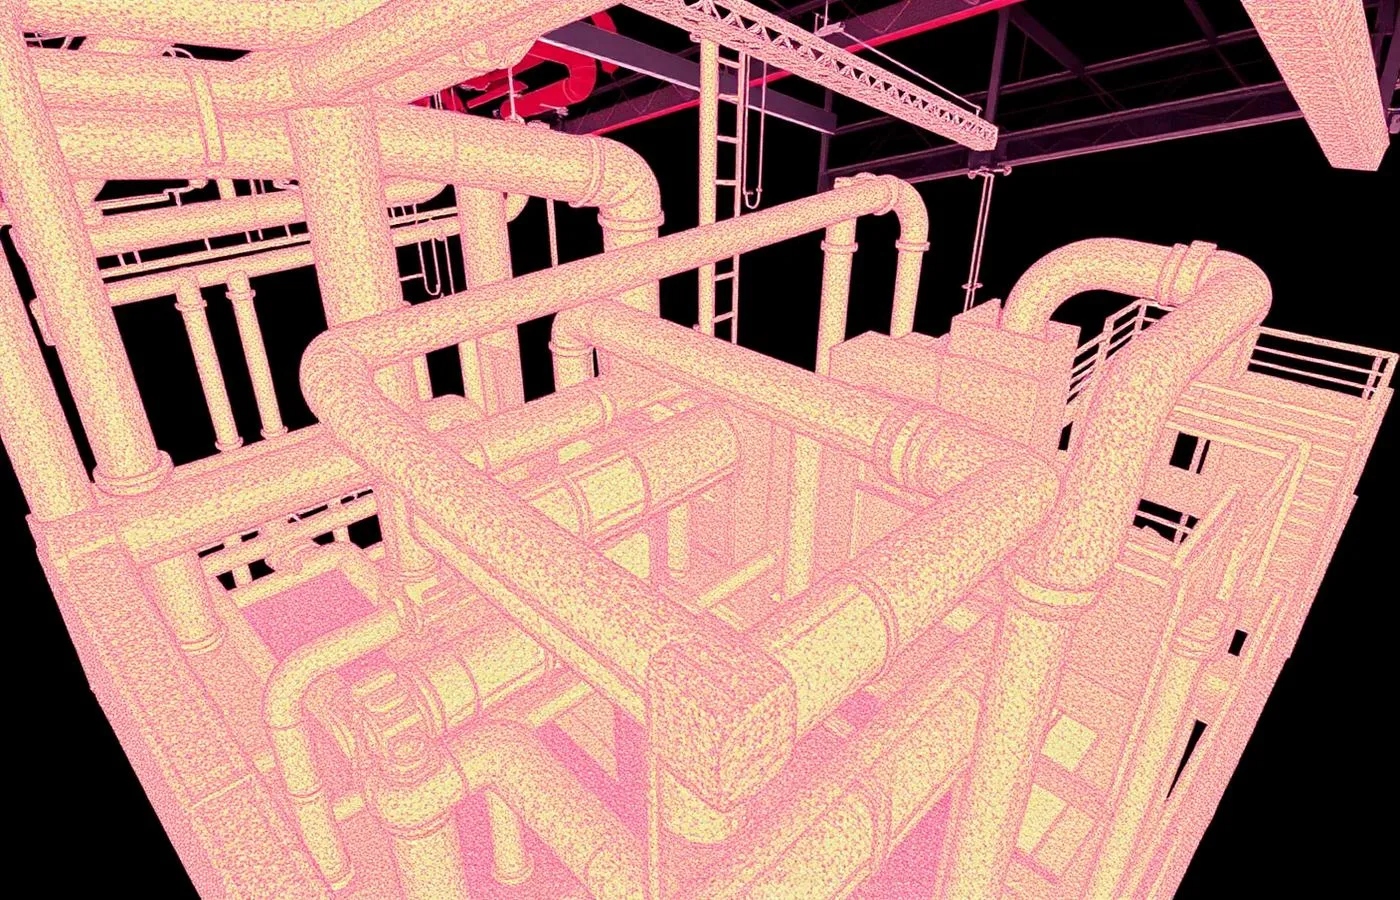
±5mm accuracy, NavVis VLX3 mobile LiDAR
Real impact on AEC project outcomes
Capture accurate conditions without stopping production
Catch as-built deviations before they become field conflicts
Get a Navisworks-ready model for coordination, not just a cloud
Work from one control network across a large, multi-level facility
Quote travel as a single line item instead of a surprise
Keep deliverable turnaround independent of jobsite distance
From kickoff to delivery in 4 clear steps
Scope and control
Define coverage, access windows, and establish the surveyed control network the scan will tie to.
Field capture
Mobile LiDAR covers open areas at speed; tripod stations resolve occluded and high-tie-in-tolerance zones.
Registration and QC
Scans are registered to control, residuals reported, and independent check measurements confirm the cloud against physical reality.
Modeling and handoff
LOD 300 modeling of structure, equipment, and piping 2 inches and larger, delivered with QC report and native formats.
Built for teams that can't afford guesswork
- Facility owners planning capital projects inside a running plant
- EPC and engineering firms needing accurate piping and structure models
- Architecture and design firms working on industrial and infrastructure projects
- Contractors coordinating tie-ins against as-built rather than as-designed conditions
- Plant engineers who need a Navisworks-ready model for clash detection
Stop losing time and money to bad data
- ✗Piping and structure that doesn't match the design PDFs
- ✗Occlusion behind equipment that a single scan pass can't resolve
- ✗Scheduling conflicts between capture and production uptime
- ✗Tie-in tolerances that fail because nothing was tied to a real control network
- ✗Out-of-region projects that stall waiting on a local crew
Specific deliverables, in formats your team already uses
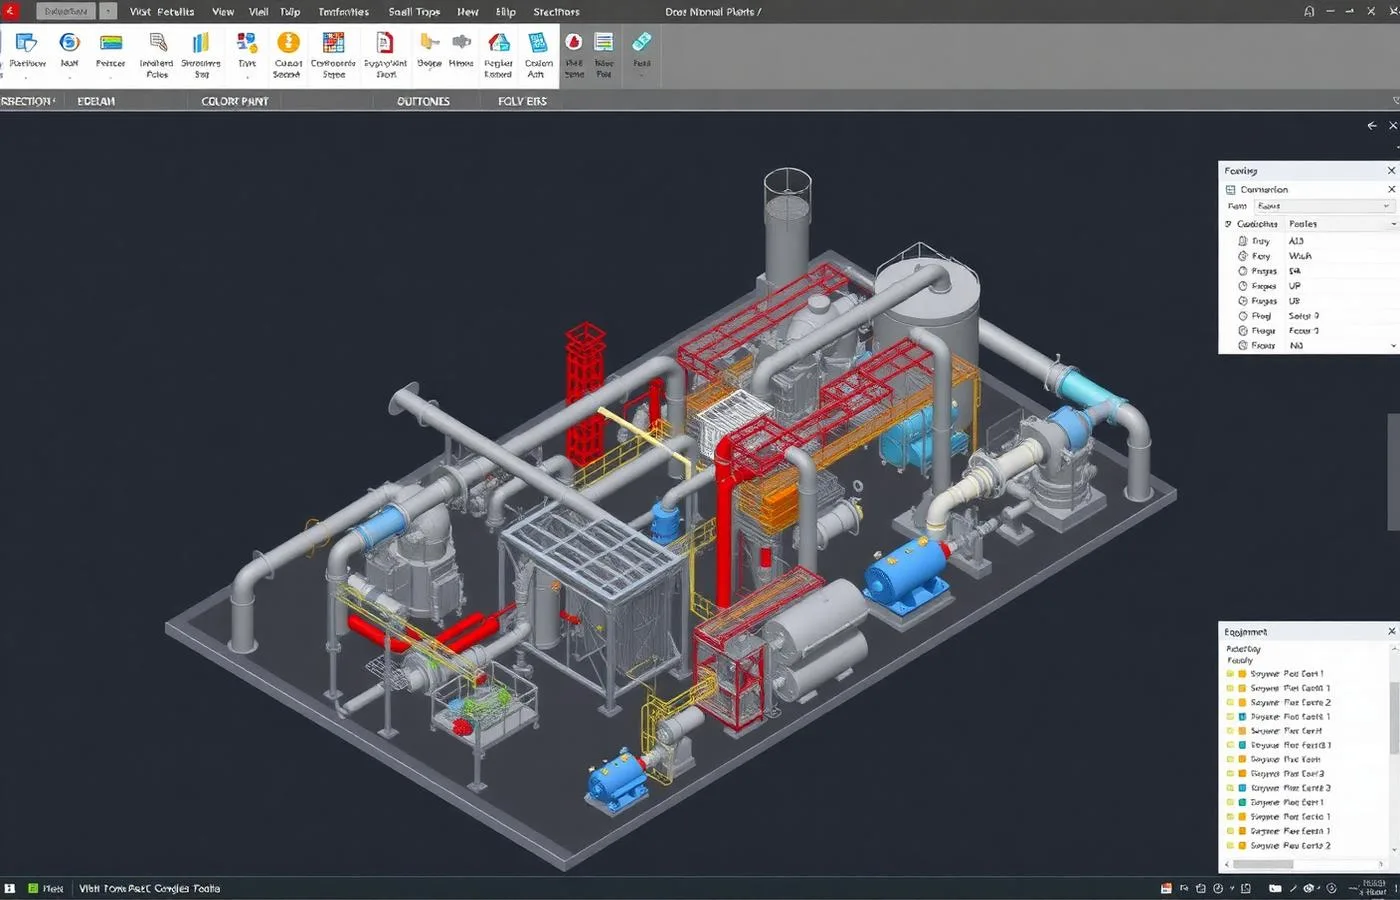
220,000 sq ft live process plant — zero downtime
An operating process plant needed a current structural and piping record without interrupting production, across a facility where the design PDFs were known to be out of date.
The plant was captured in 5 days with zero downtime. The registered model showed 143 pipe runs routed differently than the PDFs indicated, giving the engineering team a corrected baseline before any tie-in work began.
Industrial Facility Scanning Services Across the United States FAQ
Common questions about our 3D laser scanning services services
Complete Guide to Industrial Facility Scanning Services Across the United States
Industrial facility scanning across the United States starts from a different baseline than office or commercial interiors: the space itself is built to obstruct a clean line of sight. This is the nationwide, complex-interior counterpart to ZEALOT Reality Capture's regional industrial scanning service, built for plants, process facilities, and infrastructure projects anywhere in the country, not just the Midwest.
## Complex industrial interiors — what makes them hard
Dense pipe racks, occluded equipment, reflective and coated surfaces, elevated platforms, restricted access, vibration, and live process operation each break a scanning plan built for open commercial floor plates. A single scan position behind a compressor skid or beneath a mezzanine sees nothing useful; a facility with hundreds of pipe runs stacked across multiple elevations multiplies that problem across the whole plant.
Dense pipe racks and stacked piping are handled by increasing scan-position density specifically along rack runs, so overlapping fields of view resolve pipes that shadow each other from any single station. Occlusion behind large equipment — tanks, skids, transformers, vessels — is handled the same way: additional tripod setups are placed to see around the object from multiple angles rather than relying on the mobile pass alone.
Reflective and coated surfaces (stainless steel, polished tanks, painted structural steel under plant lighting) scatter or absorb laser return unevenly, which is managed by adjusting scan density and, where needed, adding stations at oblique angles that avoid direct specular return. Elevated platforms and mezzanines are captured as their own scan zones, tied into the same control network as the ground level, so a model spanning multiple elevations doesn't compound registration error level to level.
Restricted access zones — electrical rooms, permit-required confined spaces, areas behind operational equipment — are scoped before mobilization and scanned within whatever access window the facility grants, using tripod stations that don't require walking the space at all when walking isn't permitted. Vibration from running equipment is managed primarily by using mobile SLAM capture for throughput in vibration-heavy zones (which is more tolerant of minor motion during capture) and reserving static tripod scans, which are more vibration-sensitive, for areas where equipment can be briefly quieted or where vibration is minimal. Poor lighting is compensated for with supplemental lighting for photographic documentation; it does not affect LiDAR range accuracy, since the scanner is not dependent on ambient light the way a camera is.
The throughput answer across all of this is the same: mobile LiDAR (NavVis VLX3, capturing at 2.56 million points per second) covers open plant floor and walkable corridors quickly, while tripod-based static scanning is reserved for tie-in points, high-tolerance zones, and anything occluded or restricted. Both are constrained to one surveyed control network from the start, so throughput doesn't come at the cost of a plant-wide model that agrees with itself.
## Working in a live plant
Capturing an operating facility without stopping it is the single largest operational difference between industrial scanning and interior building scanning, and it's the part almost no competing provider explains in any detail. The choice between a shutdown-window scan and a continuous-operation scan is made during scoping, based on which areas are safe and practical to capture while the process runs and which require a quiet window.
For facilities that cannot pause, capture is scheduled around night and weekend shifts, or run continuously in the background of normal operations wherever it is safe to do so, minimizing disruption to production staff and equipment access. Site access on an active industrial facility runs through the plant's own procedures, not the scanning provider's: escort and badging requirements, hot-work and confined-space awareness during walkthroughs, PPE appropriate to the facility, staying clear of lockout/tagout-adjacent equipment, and respecting PSM (Process Safety Management) zones as directed by facility personnel. Where a facility operates a contractor pre-qualification portal, that process is completed as a condition of site access, the same as any other vendor entering the site.
It should be stated plainly: ZEALOT Reality Capture does not publish OSHA 10/30, TWIC, or ISNetworld credentials, and none should be assumed. What is verifiable instead is the field method — control-network ties, reported residuals, and independent check measurements confirming the registered cloud against physical reality — and a track record of delivering inside live facilities without disrupting them. On a 220,000 sq ft live process plant, the crew captured the full facility in 5 days with zero production downtime, and the resulting model showed 143 pipe runs routed differently than the design PDFs indicated — a correction the plant's engineering team could not have gotten from its existing drawings.
## Deliverables for industrial work
Industrial deliverables extend past a point cloud because the point cloud alone doesn't answer the coordination and tie-in questions a plant engineering team is actually asking. The core deliverable is an LOD 300 model covering structure, equipment, and pipe 2 inches and larger — a stated modeling convention, not a vague promise, so a client knows before the project starts exactly what will and will not appear in the piping model. Smaller-diameter lines, tubing, and instrumentation below that threshold are not modeled as standard scope; they can be added as a defined scope addition where a project requires it.
Equipment is delivered as modeled families rather than as dumb geometry, so items can be scheduled and tagged inside Revit or a comparable platform. Piping isometrics are produced from the modeled runs for fabrication and field reference. Anchor-bolt and equipment foundation plans document the base conditions needed for new equipment installs or replacements. Utility tie-in drawings show the specific connection points a mechanical or piping contractor needs to plan a tie-in without a field visit.
For coordination, NWC and NWD files are delivered so the model opens directly in Navisworks for clash detection against new design work, without an intermediate conversion step. A deviation analysis compares the as-built model against design intent where design files exist, flagging where the plant diverges from what was originally drawn. The registered point cloud itself is delivered in E57 (open master format), RCP/RCS, LAS, and PTS, so it's usable in whatever platform the client's team already runs. Every deliverable ships alongside a QC report stating the residuals from registration, not a claim of perfection with nothing behind it.
## Accuracy and control on an industrial site
Registered accuracy on industrial work is stated at ±6 mm, tied to plant control — a tighter, differently-conditioned figure than the ±5 mm architectural registered standard, because industrial sites carry risks that architectural interiors mostly don't: long unsupported spans, multi-level structures where error can compound floor to floor, and tie-in tolerances where a few millimeters of drift determines whether a new pipe spool actually lines up with an existing flange.
The control-network tie is what makes that number mean anything. Scans are constrained to surveyed control points established across the facility before capture begins; loop closures are verified as the network comes together, not assumed; and residuals are reported in the QC deliverable rather than left out of the paperwork. On a plant spanning multiple structures or elevations, that single control network is what keeps a scan taken in one corner of the facility internally consistent with a scan taken hundreds of feet away and two levels up.
The industry's own language for this is the USIBD Level of Accuracy (LOA) specification, which separates Measured Accuracy (how closely the captured data matches the real conditions) from Represented Accuracy (how faithfully the model represents what was captured). Industrial deliverables are scoped against an LOA band appropriate to the facility and the decisions the model needs to support, and that band is a project-specific conversation, not a fixed number stamped on every job. Independent check measurements — physical tape or total-station checks taken on site and compared against the registered cloud — confirm that the stated accuracy holds against the real building, not just against itself.
## Nationwide coverage and how travel works
ZEALOT Reality Capture mobilizes to industrial facilities in all 50 states from its Ohio base, and the travel model is built to be a specific, quoted line item rather than an assumption baked into a padded day rate. Out-of-region work is scheduled as a dedicated, continuous trip: the crew travels to the site once, works the facility through to completion — including night and weekend windows where a live plant requires them — and returns, rather than making repeated short visits that multiply travel cost.
Because point cloud registration and modeling happen off-site in Ohio, jobsite distance affects only the length of the field window, not how long it takes to receive deliverables. A facility in Texas or Oregon is registered and modeled on the same schedule as a facility down the road from Powell, Ohio — the timeline that changes is field scheduling and mobilization, not the production pipeline that turns captured data into a model.
This matters most for owners and EPC firms managing multi-site or multi-region programs, where a single, described mobilization approach — one crew, one control-network method, one QC standard — produces comparable results across facilities in different states, instead of stitching together output from different regional vendors with different practices.
## Timeline and cost drivers
Field capture runs at a stated rate of 80,000–120,000 sq ft per field day for open, standard-density spaces; dense industrial interiors with heavy occlusion typically capture at the lower end of that range, since additional tripod setups are required to resolve piping and equipment that mobile capture alone can't see around. A registered point cloud is delivered in 3–5 business days after field capture concludes. LOD 200 modeling runs 10–15 business days for roughly 100,000 sq ft; LOD 300 modeling, which is the standard deliverable for industrial structure, equipment, and piping, runs 3–5 weeks. A quote is returned within 24 hours of scope submission.
For a worked example: a 200,000 sq ft plant, captured at the lower end of the industrial throughput range because of pipe-rack and equipment density, runs roughly 2–3 field days. The registered cloud follows in 3–5 business days, and a full LOD 300 model of structure, equipment, and pipe 2 inches and larger follows in 3–5 weeks from that point. The line items that move the total quote are: total square footage, density of piping and equipment (which drives field days and tripod-station count), the number of separate elevations or structures on one control network, whether an LOD 300 model is required across the whole footprint or only in specific zones, and whether the site requires night, weekend, or shutdown-window scheduling. Pricing across ZEALOT Reality Capture's services generally runs $0.05–$0.20 per sq ft, with the specific rate for a given facility set once its scope, access constraints, and modeling depth are known — never a flat number quoted before scope review.