TL;DR
A Scan to BIM tolerance stack is the sum of small, acceptable deviations from reality that accumulate at each step of the process: data capture, registration, modeling, and fabrication. These errors compound, meaning a ±5mm scan accuracy and a ±10mm modeling tolerance do not cancel each other out but create a larger zone of uncertainty. This accumulated deviation can mislead designers, creating situations where a component fits perfectly in the BIM model but clashes on site, or vice versa. Understanding how to calculate and control this stack using methods like Root Sum of Squares, specifying appropriate USIBD Levels of Accuracy, and performing QA checks against the point cloud is essential for mitigating design risk in renovation and retrofit projects.
Understanding Scan to BIM Tolerance Stack Risks
TL;DR
- A tolerance stack is the accumulation of small measurement and modeling deviations.
- Errors from scanning, registration, and modeling compound rather than cancel out.
- A worked example shows how a 1" design clearance can vanish due to stacked tolerances.
- Controls include survey control, higher USIBD LOA specs, and terrestrial scanning.
- Clash detection against the point cloud, not just the BIM, is the most robust check.
Jump to:
What is a Scan to BIM tolerance stack? · How does a tolerance stack affect a design decision? · What are the primary sources of tolerance in the stack? · How is tolerance accumulation calculated? · What controls can reduce tolerance stack risks? · How does USIBD LOA relate to tolerance control? · Where to go next
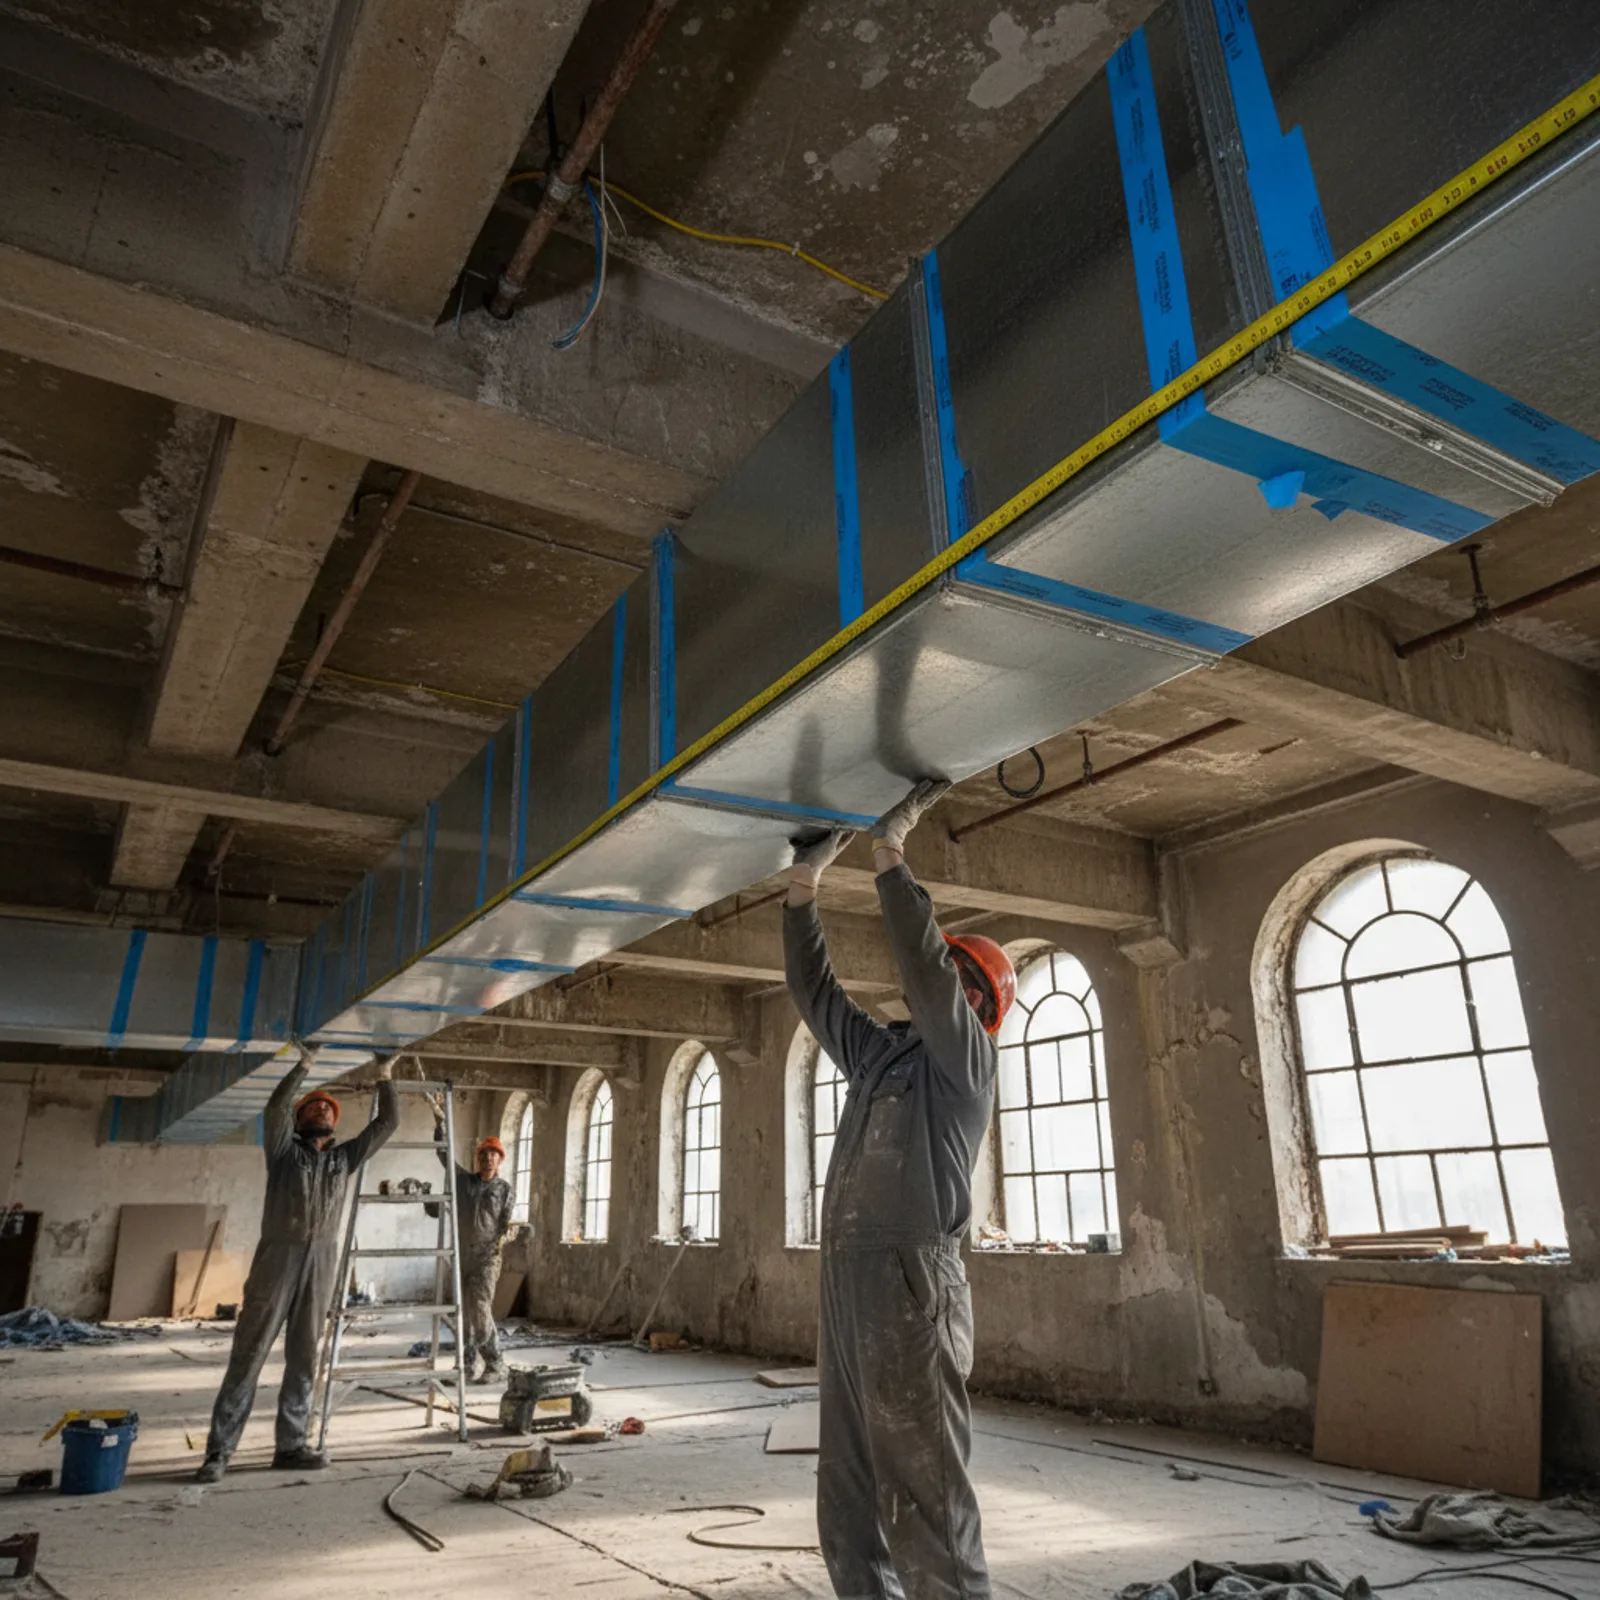
This article is for engineers, architects, and BIM managers responsible for design coordination in renovation and retrofit projects. It explains how small, acceptable deviations in a Scan to BIM project can accumulate, creating significant risk for installation clashes and rework.
Making decisions based on an as-built model requires confidence in its dimensional accuracy. But accuracy is not a single number; it is a chain of tolerances from the field to the final design file. By understanding as-built accuracy as a cumulative stack, teams can better specify deliverables and implement controls to mitigate risk.
What is a Scan to BIM tolerance stack?
A Scan to BIM tolerance stack is the sequence of acceptable dimensional deviations that accumulate at each stage of the reality capture process. No measurement or modeling task is perfect; each has an associated tolerance, or an acceptable margin of error. In the Scan to BIM workflow, these individual tolerances from data capture, registration, and modeling are layered on top of each other. The result is a total potential deviation between the final BIM model and the actual on-site conditions.
The critical concept is that these errors are cumulative. A ±5mm registration accuracy and a ±10mm modeling tolerance do not cancel each other out; they combine to create a larger zone of uncertainty. This compounding effect is the primary source of risk. An engineer might believe they are designing with a comfortable clearance, not realizing that the "existing conditions" in their model are already a simplified abstraction that differs from reality. This cumulative effect can lead to design risks from inaccurate as-builts that only become apparent during construction.
How does a tolerance stack affect a design decision?
To make this concept concrete, consider a common renovation scenario: moving a prefabricated equipment skid through an existing block wall opening into a mechanical room. The clearance is tight, and the decision to proceed depends on the modeled dimensions. This gap between the modeled world and the physical world is where a Scan to BIM tolerance stack lives.
Worked Example: The Skid and the Doorway
- The Skid: A new pump skid is fabricated to be exactly 48" wide. The fabrication process has its own tolerance, and the skid arrives on site measuring 48.2" wide. This is a fabrication tolerance of +0.2" (+5mm).
- The Real Opening: The actual, physical opening in the block wall measures 48.5" at its narrowest point. This is the ground truth.
- The Scan Capture: A laser scanner is used to capture the existing conditions. The scanner has an instrument tolerance, and due to the angle of capture and texture of the block, it measures the opening as 48.7" wide. This is a capture tolerance error of +0.2" (+5mm).
- The Registration: During processing, a slight rotational error between scans of the interior and exterior of the room shifts the point cloud data. This registration residual makes the opening appear wider still, now measuring 48.9". This is a registration tolerance error of +0.2" (+5mm).
- The BIM Modeling: A BIM technician receives the point cloud. The modeling scope calls for LOD 200 elements. The technician fits a standard door family to the fuzzy point cloud data. The closest standard family size that fits the 48.9" cloud data is a 49" opening. The model now shows a clean, dimensionally perfect 49.0" opening. This is a modeling abstraction tolerance of +0.1" (+2.5mm).
The Decision and the Clash
The design engineer opens the Revit model. They see a 49.0" opening and a 48.0" wide skid in their design file. The model shows a 1.0" clearance, which is sufficient. The equipment move is approved.
On installation day, the 48.2" wide skid is brought to the 48.5" wide opening. The real-world clearance is only 0.3". The 1.0" clearance shown in the model was an illusion created by a stack of tolerances all accumulating in the same direction. Any slight misalignment during the move will cause a collision, forcing a work stoppage. The team may need to chip away at the block wall or partially disassemble the skid, incurring delays and cost overruns.
What are the primary sources of tolerance in the stack?
Each stage of the Scan to BIM process contributes to the total stack. Understanding these sources is the first step toward controlling them.
- Capture Tolerance: This is the inherent accuracy limitation of the laser scanning hardware itself. It is influenced by the instrument's range, beam divergence, and measurement engine. While a manufacturer may state a single accuracy number, it's important to know what ±5mm accuracy really means in practice, as it can vary with distance and environmental conditions. ZEALOT uses terrestrial scanners for high-precision setups and NavVis VLX3 mobile mappers for rapid capture, each with a different tolerance profile.
- Registration Residual: Individual scans are like digital photographs from different positions; they must be stitched together into a cohesive whole. This process, called registration, is never perfect. The residual error is the average measured misalignment between overlapping scans. A low residual (e.g., under 5mm) indicates a high-quality registration. This is one of the most significant contributors to overall project accuracy.
- Modeling Abstraction Tolerance: This is the deviation introduced when a BIM technician interprets a dense, messy point cloud and creates clean, idealized BIM geometry. A modeler must decide where the "true" face of a wall is within a 10mm-thick band of points. They fit standard families (like doors or windows) to non-standard openings. This step often introduces the largest single error in the stack and is directly controlled by the specified Level of Accuracy (LOA).
- Fabrication & Installation Tolerance: The final pieces of the stack come from the physical world. A steel beam, concrete pour, or fabricated duct will not have the perfect dimensions of its digital counterpart. Likewise, installers work within an accepted tolerance for placement. These values must be accounted for by the designer when calculating required clearances.
How is tolerance accumulation calculated?
There are two primary methods for estimating the total accumulated tolerance.
A Worst-Case (Linear) Stack simply adds the maximum tolerance from each step. Using the skid example:
0.2" (Capture) + 0.2" (Registration) + 0.1" (Modeling) = 0.5" Total Error
This method is simple but often overly pessimistic, as it assumes every error is at its maximum value and acting in the same direction. Designing for worst-case scenarios can lead to unnecessary over-engineering and increased costs.
A Root Sum of Squares (RSS) Stack is a statistical method that provides a more probable result. It is calculated as the square root of the sum of the squares of each individual tolerance.
√(0.2² + 0.2² + 0.1²) = √(0.04 + 0.04 + 0.01) = √0.09 = 0.3"
The RSS method yields a total probable error of 0.3". This is a more realistic estimate because the random nature of errors makes it statistically unlikely for all of them to align perfectly. While not an absolute guarantee, RSS analysis avoids the over-conservative results of worst-case stacking, which can inflate project costs and lead to unnecessary design rework from inaccurate as-builts.
What controls can reduce tolerance stack risks?
While tolerances cannot be eliminated, they can be measured, managed, and minimized. The goal is to shrink the stack, especially for design-critical elements.
| Tolerance Source | Magnitude Contribution | Control Method |
|---|---|---|
| Capture Tolerance | Low (±1-5mm) | Use of high-end terrestrial scanners for critical tie-ins. Specify a higher scan density (resolution). |
| Registration Residual | Medium (±3-10mm) | Enforce use of surveyed control targets. Require a detailed registration report showing cloud-to-cloud error statistics. |
| Modeling Abstraction | High (±3-15mm) | Specify a stricter USIBD Level of Accuracy (e.g., LOA 30 instead of LOA 20). Provide clear modeling instructions. |
| Design Interpretation | Variable | Perform clash detection against the point cloud itself, not just the simplified BIM model. |
| Fabrication/Installation | Variable | Account for standard fabrication and installation tolerances in design clearance calculations. |
One of the most effective controls is procedural: running clash detection directly between a new design model and the registered point cloud is a powerful form of BIM quality control and tolerance analysis. This check bypasses the modeling abstraction error and compares the design intent against the most accurate available data. For projects with mixed criticality, the team can specify terrestrial scanners for critical areas and rely on faster mobile vs.terrestrial laser scanning for general context, optimizing both cost and accuracy.
How does USIBD LOA relate to tolerance control?
The U.S. Institute of Building Documentation (USIBD) provides a Level of Accuracy (LOA) standard that is essential for managing the tolerance stack. Unlike Level of Development (LOD), which defines how much detail a model element contains, LOA defines how accurately that element's location and geometry reflect the point cloud data.
Specifying an LOA within a Scan to BIM scope of work is the primary method for controlling the modeling abstraction tolerance.
- LOA 20: Modeled element is within a tolerance of 1/2" (12.7mm) of the point cloud at a 95% confidence level. This is suitable for general context and visualization.
- LOA 30: Modeled element is within a tolerance of 1/8" (3.175mm) of the point cloud at a 95% confidence level. This is required for design-critical components, such as structural connections or MEP tie-in points.
By requiring LOA 30 for the block wall opening in the earlier example, the modeling tolerance would have been shrunk from ~6mm to ~3mm, reducing the total stack and providing the designer with a more reliable model. This aligns with the specified Level of Development (LOD) for the BIM elements, ensuring that elements that are detailed for fabrication are also positionally accurate.
Where to go next
Understanding and specifying tolerance controls are fundamental to de-risking renovation projects that rely on as-built data. To define these requirements in your next project, review how to create a detailed 3D laser scanning scope of work. To ensure a provider can meet these technical requirements, learn more about how to evaluate 3D laser scanning providers.