TL;DR
Deformation monitoring with 3D laser scanning involves a systematic process of repeat scanning to detect structural changes. A successful program begins with establishing a durable survey control network that remains stable across all measurement epochs. Scans are scheduled at intervals determined by the anticipated rate of movement and environmental factors, using consistent scanner locations and settings. Data from different epochs are compared using methods like cloud-to-cloud or cloud-to-mesh analysis to produce deviation heatmaps. Given the technology's typical ±5mm registered accuracy, analysis must distinguish between actual movement and measurement noise by setting clear detection thresholds and looking for trends. For movements smaller than 5-10mm or for specific point-based tracking, laser scanning should be supplemented with higher-precision tools like total stations or geotechnical sensors.
Deformation Monitoring With 3D Laser Scanning: A Guide
TL;DR
- A stable control network is the foundation for any multi-epoch scan project.
- Scan epochs must be precisely aligned to the control network for valid comparison.
- Analysis distinguishes real movement from noise by setting a threshold above the scanner's accuracy limits.
- Comparison methods like Cloud-to-Cloud (C2C) generate heatmaps showing deviation.
- For movements under 10mm, supplement scanning with higher-precision tools like total stations.
Jump to: What is deformation monitoring with 3D laser scanning? · How is a durable control network established for repeat scans? · What is the optimal schedule for repeat scanning? · How are scan epochs compared to detect movement? · How is real deformation distinguished from measurement noise? · What reporting methods are used for deformation analysis? · When should laser scanning be supplemented with other monitoring tools? · Where to go next
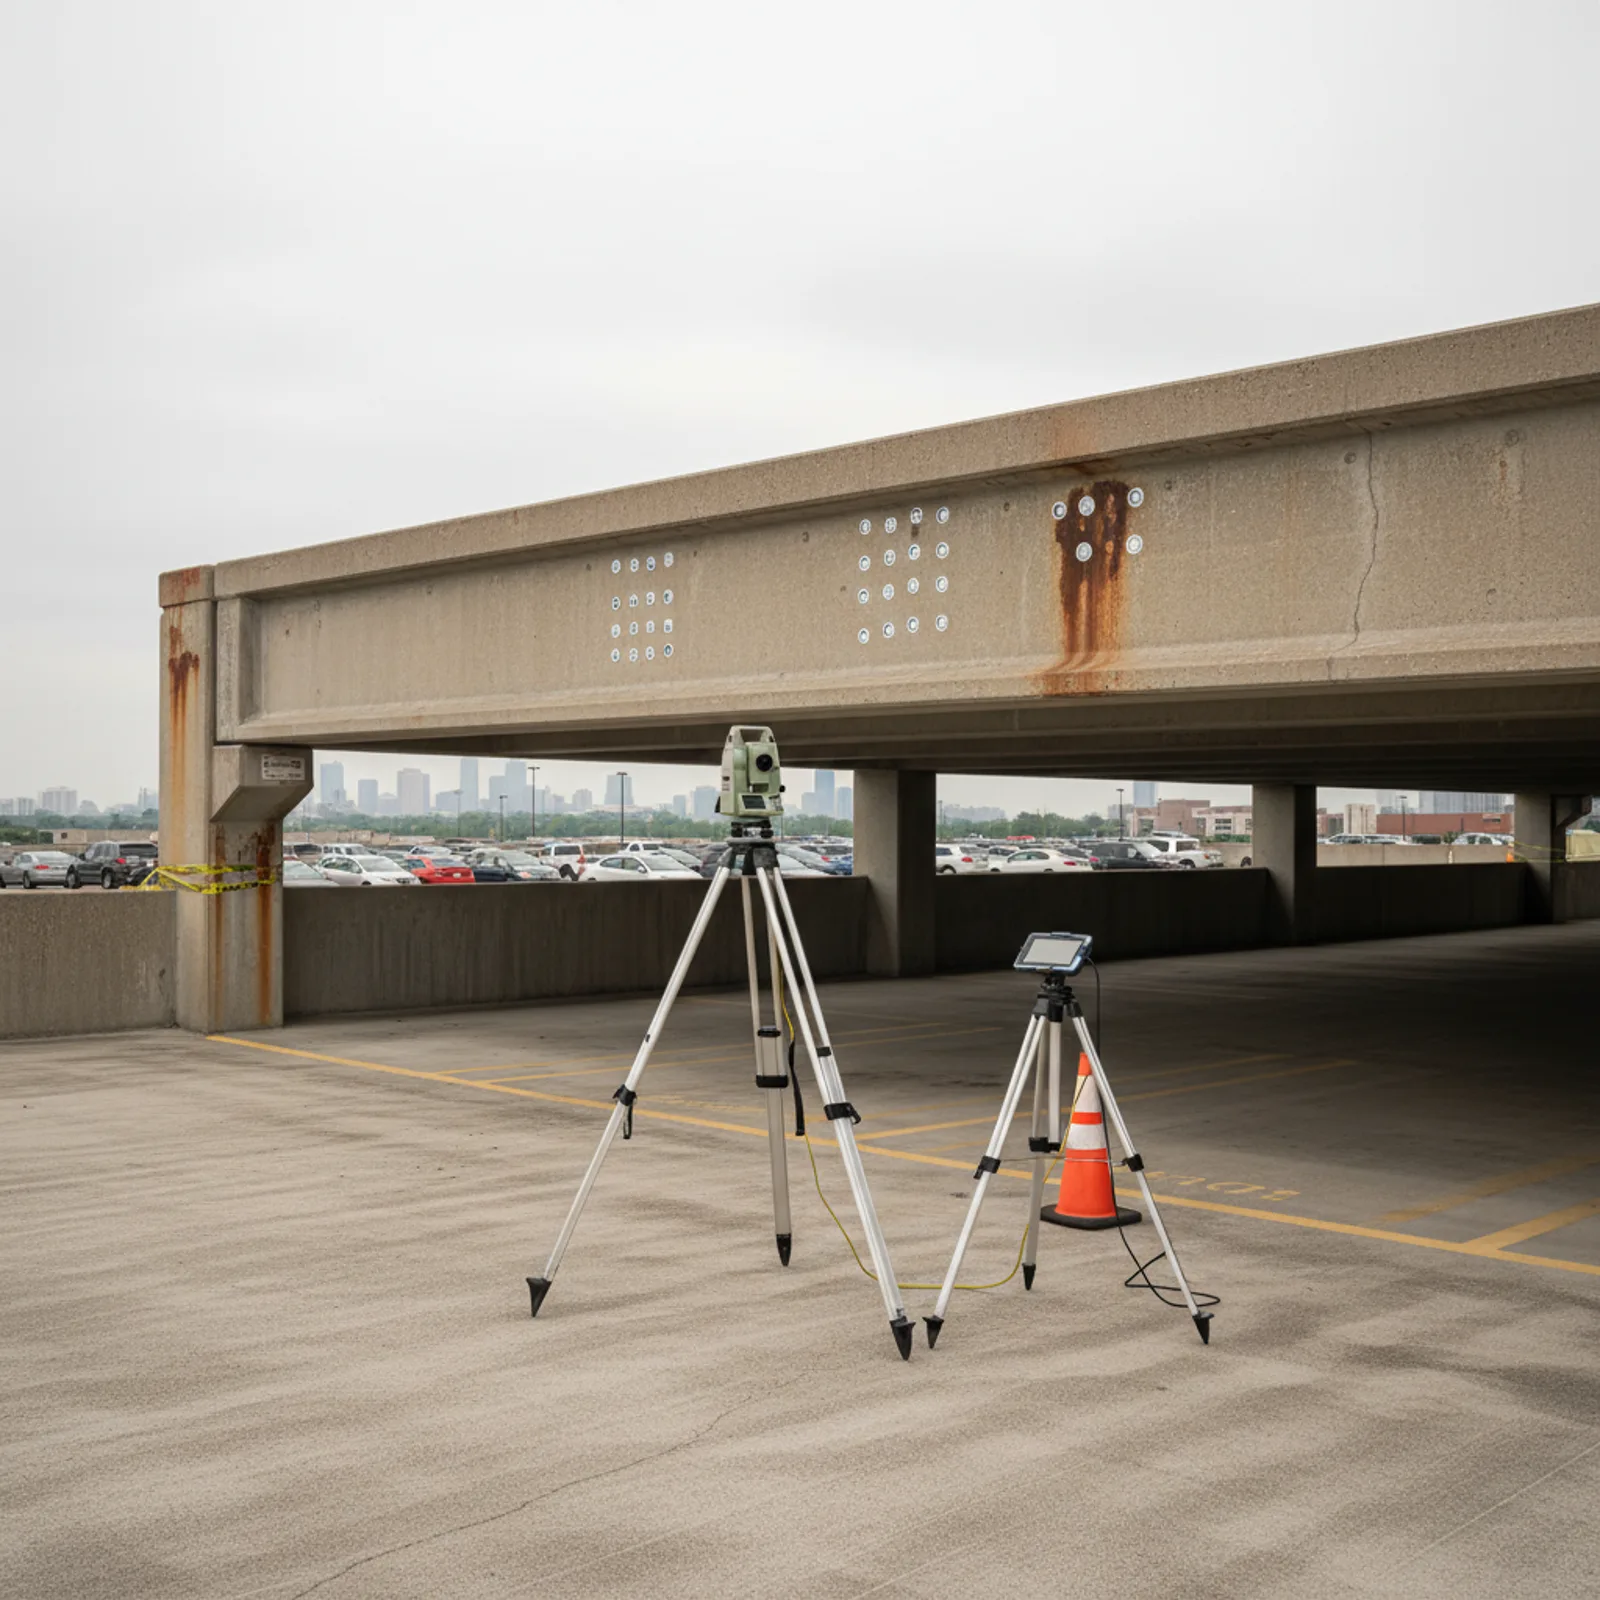
This guide is for structural engineers, facility managers, and forensic investigation teams who need to measure structural movement over time. It provides a practical framework for implementing a monitoring program using 3D laser scanning, from initial setup to data analysis and reporting. The focus is on the procedural steps required to produce reliable and actionable deformation data.
Executing a successful program requires more than just a scanner; it demands a rigorous methodology for data capture and analysis. The process involves repeat scanning of a structure or site to create a time-series of high-density 3D point clouds. By comparing these datasets, known as epochs, analysts can identify and quantify changes. This information supports decisions related to structural safety, maintenance interventions, and construction sequencing for projects like building scanning for structural assessment.
What is deformation monitoring with 3D laser scanning?
Deformation monitoring with 3D laser scanning is a surveying technique used to track changes in a structure's shape or position over time. The process begins by capturing a baseline point cloud of the subject—a bridge, building façade, dam, or retaining wall—in its initial state. This first scan serves as the primary reference, or "epoch zero." Subsequent scans are performed at defined intervals (e.g., monthly, quarterly, or after a specific event like an earthquake or heavy loading).
Each new point cloud is registered, or aligned, to the exact same coordinate system as the baseline scan. This is the most critical step and relies on a stable survey control network. Once aligned, specialized software compares the datasets point-by-point or against a reference surface. The output is a quantitative analysis of surface deviation between epochs, often visualized as a color-coded heatmap. This allows engineers to see not just *if* movement occurred, but precisely *where* and by *how much*. This method provides a comprehensive view of area-wide behavior that is difficult to achieve with traditional discrete-point monitoring.
How is a durable control network established for repeat scans?
A durable control network is the bedrock of a reliable deformation monitoring program. Its purpose is to provide a fixed, unchanging 3D reference frame that all scan epochs can be tied to. Without it, distinguishing real structural movement from data alignment errors is impossible. The foundation of any robust point cloud control for deformation analysis is survey-grade stability.
Establishing the network involves several steps:
- Target Selection and Installation: Permanent survey targets (e.g., adhesive checkered targets, spheres, or fixed prisms) are installed on stable surfaces outside the area of expected movement. Ideal locations include adjacent, structurally independent buildings or purpose-built monuments like concrete pillars with deep footings. The goal is to ensure the control points themselves do not move.
- Survey Measurement: A licensed surveyor uses a high-precision instrument like a total station to measure the 3D coordinates of each target with sub-millimeter accuracy. This establishes the official coordinate system for the entire project.
- Network Validation: The surveyor performs a network adjustment to validate the geometry of the control points and confirm their stability relative to one another. This step ensures the integrity of the reference frame before the first laser scan is even performed.
During each subsequent scanning campaign, the laser scanner captures these same control targets. Registration software then uses the known coordinates of the targets to lock the new point cloud into the project's master coordinate system. This ensures that any measured differences between epochs are due to changes in the structure, not shifts in the data's origin point.
What is the optimal schedule for repeat scanning?
The schedule for repeat scanning is dictated by the anticipated rate of movement and the project's risk profile. There is no one-size-fits-all answer; the frequency must be tailored to the specific application. For a building adjacent to major excavation, weekly or even daily scans might be necessary during the most intensive construction phases. For long-term monitoring of a historic masonry façade, a semi-annual or annual schedule may be sufficient to track slow, seasonal changes.
Beyond the rate of movement, environmental factors play a critical role in scheduling. Thermal expansion and contraction can cause a structure to move by several millimeters throughout a single day. To avoid misinterpreting this daily thermal cycling as permanent deformation, all scans should be conducted under similar environmental conditions. This typically means scanning at the same time of day (e.g., early morning before direct sun exposure) and, if possible, during similar weather conditions. Documenting the ambient temperature, cloud cover, and time of day for each scan is standard practice and provides essential context during data analysis.
For large facilities, such as an 80,000–120,000 sq ft warehouse, a provider might use a combination of tripod-mounted terrestrial scanners for high-precision exterior control and a mobile LiDAR system like the NavVis VLX3 for walking-pace capture of interior floor slabs. Coordinating these different hardware types within a consistent timing window is key to a valid comparison.
How are scan epochs compared to detect movement?
Once two or more point cloud epochs are registered to the same stable control network, the actual analysis can begin. Several computational methods are used to measure the differences between the datasets.
Cloud-to-Cloud (C2C) Comparison: This is the most direct method. The software calculates the shortest distance from each point in one cloud (e.g., the current epoch) to the nearest point in the reference cloud (the baseline). It is computationally intensive but provides a raw measure of change across the entire scanned surface. This method is effective for identifying general areas of movement but can be sensitive to variations in point density between scans.
Cloud-to-Mesh (C2M) Comparison: This is the most common and often most reliable method. A 3D triangular mesh surface is generated from the baseline point cloud, creating a continuous digital representation of the structure's initial state. Then, the points from each subsequent scan epoch are compared to this reference mesh. The software calculates the perpendicular distance from each point to the mesh surface. C2M analysis is less sensitive to point density variations and tends to produce cleaner, more interpretable results. The output is almost always a deviation heatmap.
Point-to-Point Comparison: For monitoring specific, predefined locations, analysts can place virtual survey points within the baseline point cloud. The software then finds the corresponding position in subsequent epochs and calculates the 3D displacement vector (dX, dY, dZ). This is useful for tracking the movement of specific features like the corner of a beam or a crack monitor, mimicking the function of a traditional prism-based survey.
How is real deformation distinguished from measurement noise?
This is the central challenge in any 3D laser scanning deformation study. Laser scanning is not infinitely precise. A registered point cloud from a high-quality terrestrial scanner typically has a global accuracy of ±5mm. This means any single point measurement has an uncertainty of 5mm in any direction. Therefore, a reported deviation of 3mm between two epochs is statistically insignificant—it falls within the noise band of the measurement system.
To confidently identify real deformation, analysts use two primary strategies:
- Setting a Threshold: A minimum threshold for detectable movement is established, usually at double the system's accuracy specification (e.g., 10mm for a ±5mm system). Any measured deviations below this threshold are flagged as potential noise and require further evidence. Understanding what ±5mm accuracy really means is critical for setting realistic expectations.
- Trend and Cluster Analysis: Real deformation rarely manifests as a single, isolated point of deviation. Instead, it appears as a cluster of adjacent points all showing a similar magnitude and direction of movement. Furthermore, when analyzing a series of three or more epochs, true movement will show a consistent trend over time (e.g., a slab progressively deflecting downward), whereas noise will appear as random, oscillating positive and negative values. A single point showing a 12mm deviation might be an anomaly, but a 1-square-meter area where thousands of points average a 12mm deviation is a clear indicator of movement.
What reporting methods are used for deformation analysis?
The goal of reporting is to translate millions of data points into clear, actionable information for stakeholders. Raw deviation numbers are not enough; the data must be visualized and contextualized.
Common reporting deliverables include:
- Deviation Heatmaps: These are the primary visual tool. A 3D model or 2D elevation drawing is colored based on the magnitude of deviation from the baseline. A color scale (e.g., blue for negative deviation, red for positive) and a legend clearly communicate where and how much the structure has moved.
- Deviation Annotations: Specific points of interest (POIs) are labeled directly on the heatmap or drawings with their exact deviation values. This is useful for calling out maximum deflection points, movement at column heads, or changes at construction joints.
- Vector Plots: In some cases, 2D or 3D arrows can be used to show not just the magnitude but also the direction of movement for specific points or areas.
- Cross-Sections and Profiles: 2D slices are cut through the aligned point clouds from different epochs. Plotting these profiles on top of each other provides a simple and effective way to visualize changes in shape, such as slab deflection or wall bowing.
- Threshold Alarms: The report will clearly identify any areas that have exceeded pre-defined movement thresholds or "alarm levels." This immediately draws attention to the most critical areas requiring engineering review.
When should laser scanning be supplemented with other monitoring tools?
3D laser scanning is powerful for capturing area-wide deformation, but it has limitations. Its strength is in documenting the overall geometric response of large surfaces. It is less suited for ultra-high-precision point tracking or measuring certain types of movement. The decision of when to use it alone versus as part of a hybrid approach depends on the expected magnitude and type of movement. The reasons why 3D laser scanning struggles with deformation at very small scales are rooted in its accuracy limits.
The table below provides a general guide for selecting monitoring technology based on the scale of movement. A comprehensive program often combines multiple methods to create a complete picture of structural behavior.
| Technology | Typical Accuracy | Best For Movement Magnitude | Use Case Example |
|---|---|---|---|
| 3D Laser Scanning | ±5mm | >10mm (large area) | Façade bulging, slab deflection over a wide area, large-scale settlement. |
| Total Station & Prisms | ±1-3mm | 3–10mm (discrete points) | Monitoring specific crack widths, column plumbness, beam sag at specific points. |
| Tiltmeters / Inclinometers | <0.01 degrees | Angular rotation | Wall tilting, foundation rotation, structural member twist. |
| Strain Gauges | Microstrains (µε) | <1mm (localized stress) | Material stress changes in critical steel or concrete members under load. |
| GPS/GNSS | ±5-20mm (relative) | >20mm (absolute position) | Large-scale site settlement, dam movement, landslide monitoring. |
In practice, a project might use laser scanning to get a baseline of an entire façade, while installing a total station and prisms to monitor three specific cracks with higher precision. The two datasets complement each other, with the scanner providing context for the high-precision point data.
Where to go next
A well-defined deformation monitoring program provides quantitative, defensible data for critical asset management and safety decisions. The methodology outlined here serves as a starting point for discussions between asset owners and reality capture providers.
To ensure success, it is important to partner with scan to BIM providers who specialize in supporting structural teams. For more detail on creating a clear project plan, review best practices for developing a 3D laser scanning scope of work.